In the world of product design, “I think the user will like this” is a dangerous sentence. To build an intuitive digital assets that actually work whether it’s a consumer app or a website or any feature for B2B, B2C and D2C, we need to move from assumption to evidence. Here is a breakdown of the qualitative and quantitative framework we use to test usability, illustrated by a study conducted for a consumer app for TATA AIA Life.
List of Topic Covered
1) The Methodology
We used hybrid approach i.e. mix of both qualitative and quantitative research method.
- Qualitative : 1-on-1 remote usability interviews to understand the “Why.”
- Quantitative : The system usability scale (SUS) to understand the “What” and establish a benchmark score.
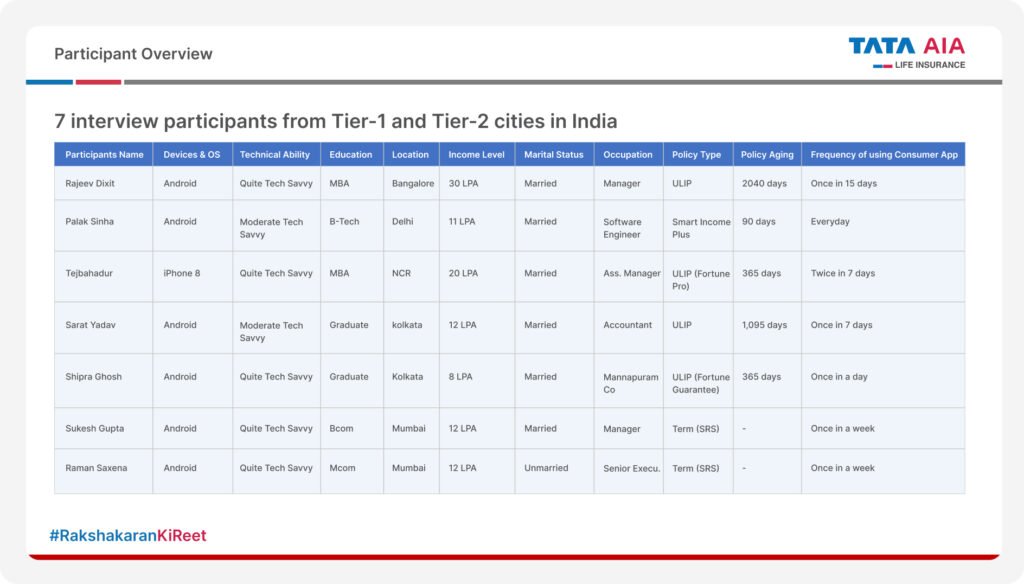
2) Participant Recruitment
For this study, we recruited 7 participants from Tier-1 and Tier-2 cities (Mumbai, Delhi, Kolkata, Bangalore). Participants were classified based on tech-savviness, demographics, and app usage.
- Tech Savviness: Ranged from “Moderate” to “Quite Tech Savvy.”
- Demographics: Varied income levels (8 LPA to 30 LPA) and education backgrounds.
- Context: We included users who use the app daily versus those who use it once a fortnight. This ensures the feedback covers both power users and casual visitors.
3) Process
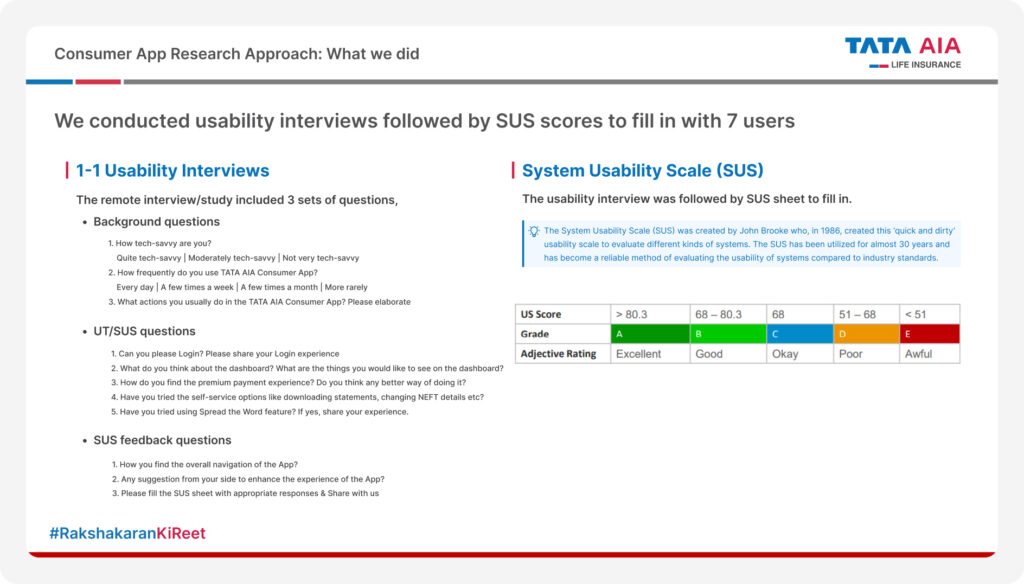
Our interview involved 3 main sections i.e. background, task execution and measurements.
- Background: Understanding the user’s digital behavior and tech comfort.
- Task Execution: We asked users to perform critical actions and then observing them to perform those tasks (e.g., “Can you please Login?”, “Check the dashboard for offers”).
- Measurement: Asking users to fill out the 10 item System Usability Scale (SUS) sheet immediately after the session.
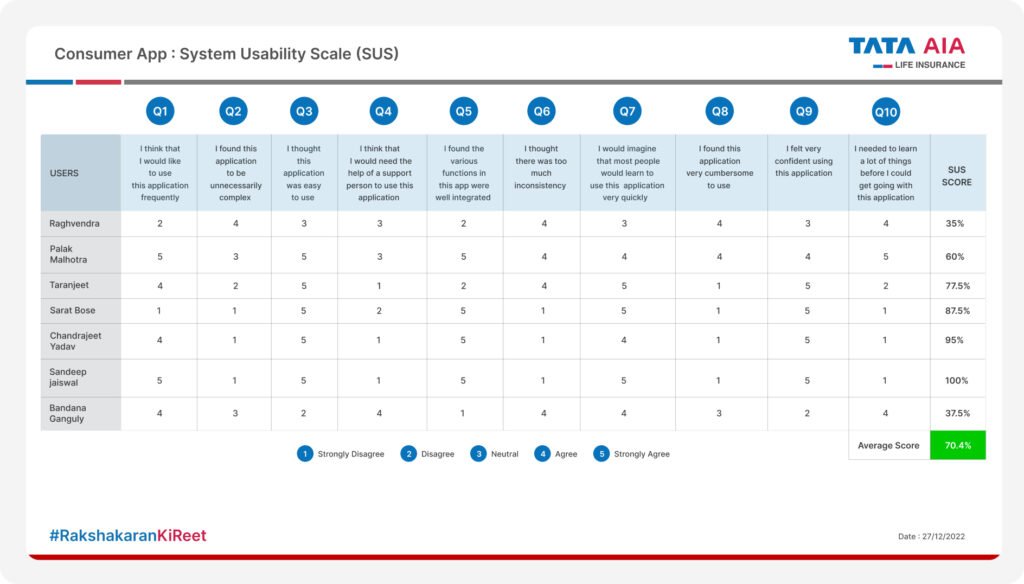
4) Scoring : Understanding the Grade
The System Usability Scale (SUS) gives us a raw score out of 100. It is a reliable industry standard for grading usability. In our study, we calculated the scores for all 7 users.
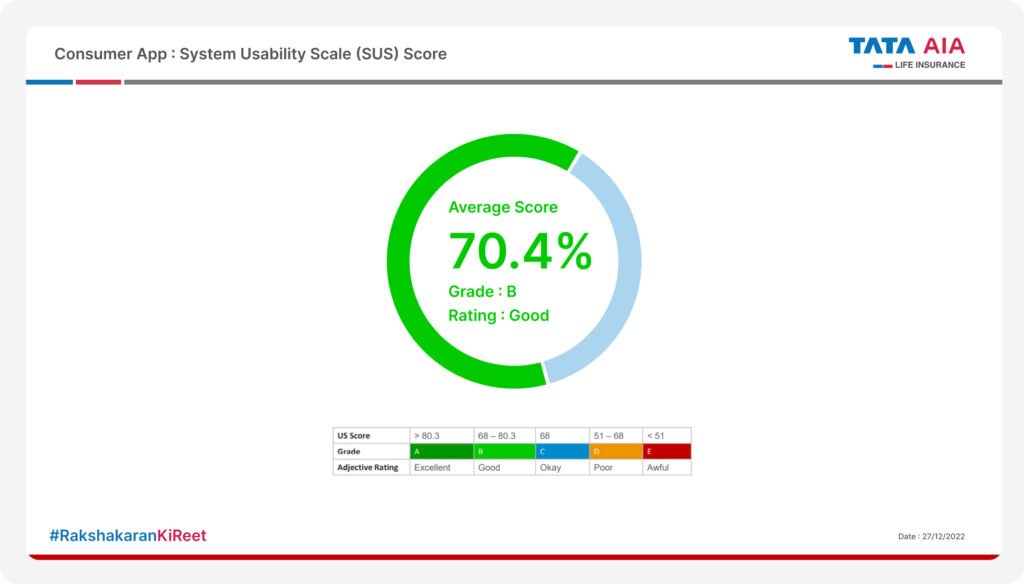
- The Result: We got an average score of 70.4%.
- The Verdict: This places the User Experience at a Grade B (Good) rating. It’s above average, but there is room for improvement.
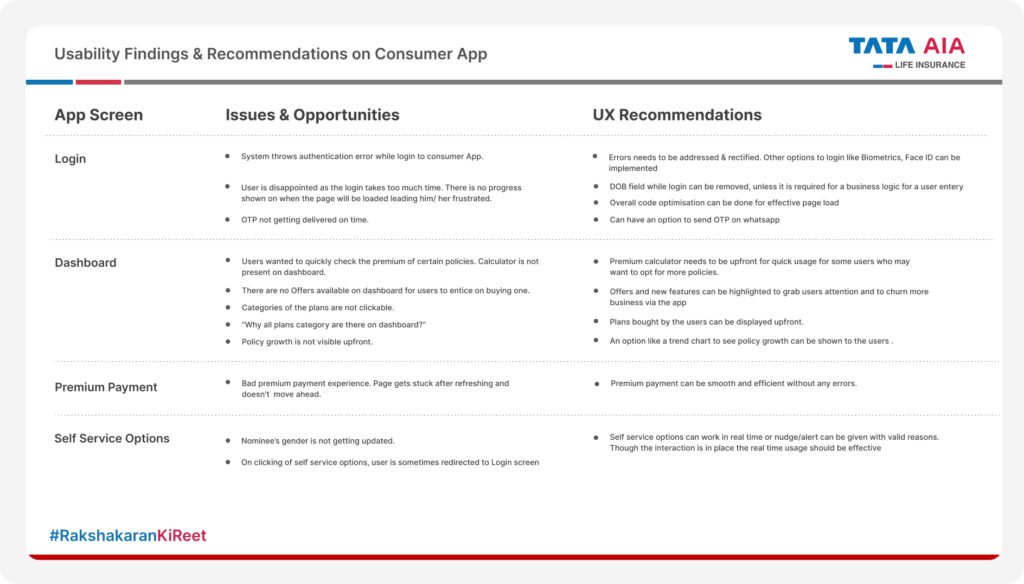
5) Turning Insights into Action
Data is useless without recommendations. We mapped every pain point observed during the “Task Execution” phase to a specific UX Recommendation.
- Issue: Users found the login process slow and lacked status visibility.
- Fix: Implement Biometrics/Face ID and remove unnecessary fields like DOB.
- Issue: Users couldn’t see policy growth upfront.
- Fix: Introduce a trend chart on the dashboard for immediate value visualization.
Conclusion
By combining the rigid structure of SUS scores with the empathetic insights of 1-on-1 interviews, we don’t just get a “score” we get a roadmap for improvement. This process ensures that every design update we make is rooted in real user needs, not internal opinions.
How do you measure usability in your projects? Do you rely on SUS or pure observation? Let’s chat in the comments!