
Most investors want clear mutual fund app insights, yet most apps only show a scoreboard. You see current value, amount invested and a return percentage. Sometimes you also get a pie chart. That tells you what happened. However, it does not tell you why, whether it is good, or what to do next.
In this article, I walk through 10 insight screens I designed for a mutual fund app. For each one, you will see the problem, the screen and the design thinking behind it.
Note: all numbers are sample data for a ₹15.6 lakh portfolio with a ₹15,000 monthly SIP. Fund names such as "ABC Flexi Cap" are placeholders.
List of Topic Covered
Why mutual fund app insights matter
Investors keep asking the same questions.
- Am I diversified?
- Am I paying too much in fees?
- Will I reach my goal?
- What happens if markets crash?
Today, many of them look for answers on spreadsheets, YouTube or WhatsApp groups. Yet the app already holds all the data it needs. Good mutual fund app insights simply turn that data into answers.
Design principles behind these mutual fund app insights
Every screen follows the same six rules. Together, they keep the mutual fund app insights simple and useful:
- Lead with one sentence. Each screen opens with a plain headline, such as “Your 4 funds behave like 1.6 funds.”
- Speak in rupees. “₹18,400 paid in fees” is clearer than “1.7% expense ratio”.
- End with one action. An insight without a next step only creates worry.
- Stay honest. Some screens show the user’s funds losing to an index. That honesty builds trust.
- Label urgency. Each insight carries a tag: Act now, Review, Good or Info.
- 6. Keep one layout. Users learn the pattern once and then read every screen faster.
1. Hidden fund overlap: the first of 10 mutual fund app insights
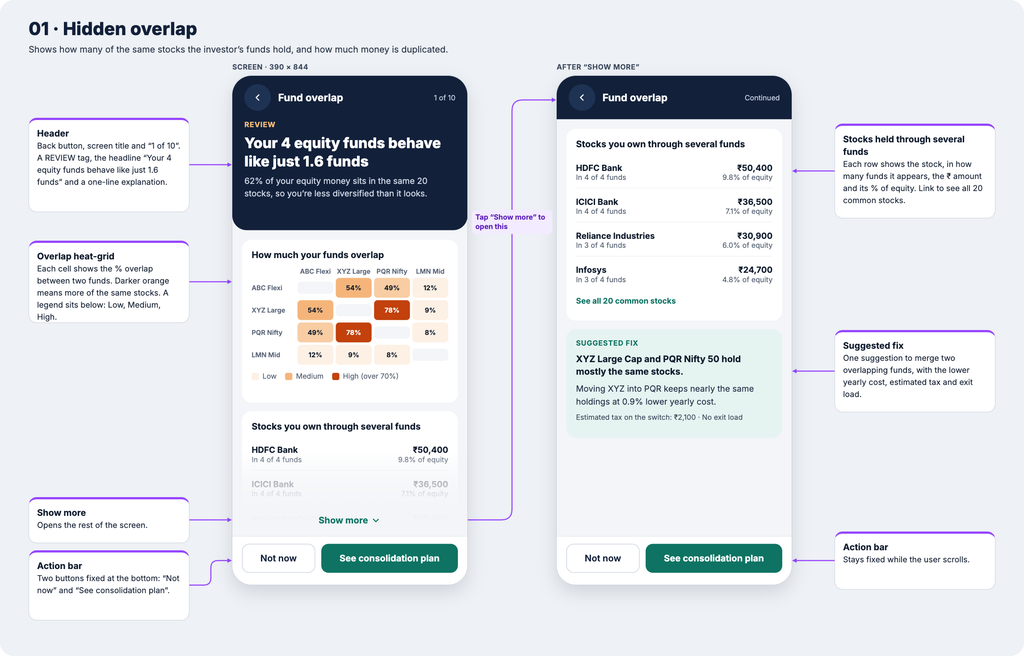
Overlap is the insight most apps miss. Many investors buy a flexi-cap, a large-cap and an index fund. They feel diversified. In reality, all three often hold the same top stocks.
The overlap screen makes this visible. Its headline reads: “Your 4 equity funds behave like just 1.6 funds.” Below that, a heat-grid shows how much each pair of funds overlaps. A list then shows stocks you own through several funds, with the rupee amount in each.
Finally, the screen suggests one fix. For example, it may suggest merging two funds that overlap 78%. It also shows the tax impact before you act.
2. Fee drag in rupees
Fund fees come out of the NAV every day. As a result, investors never see a bill and rarely feel the cost.
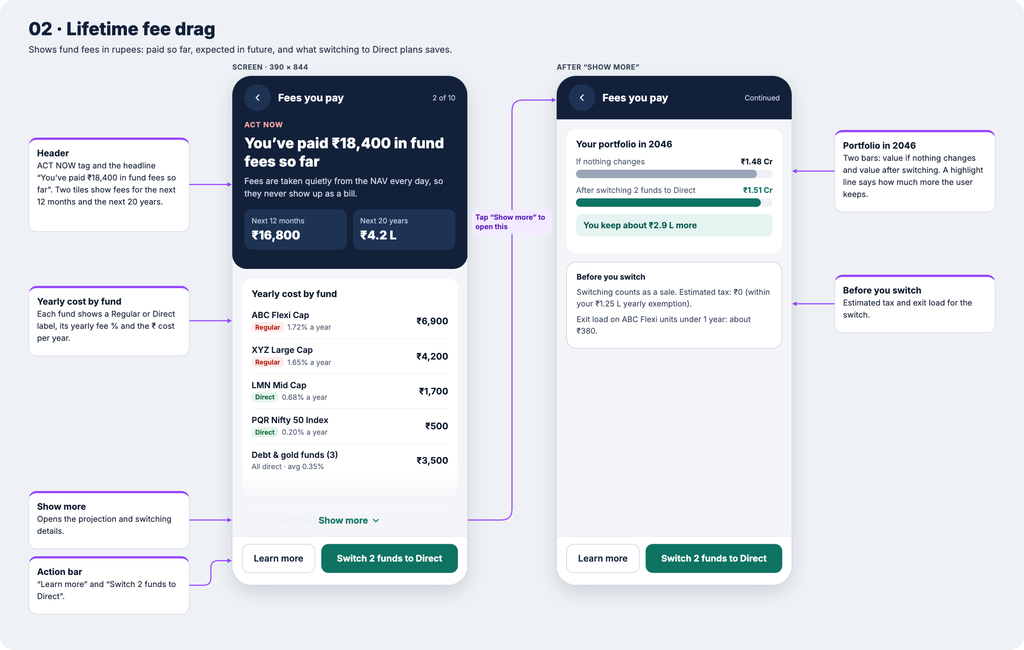
This screen changes that. The headline says: “You’ve paid ₹18,400 in fund fees so far.” It also projects fees for the next year and the next 20 years.
Each fund shows its yearly cost in rupees, along with a Regular or Direct label. A simple comparison then shows how much more you keep by switching to direct plans. Before the button, a small box lists any exit load or tax, so there are no surprises.
3. Your return vs the fund’s return
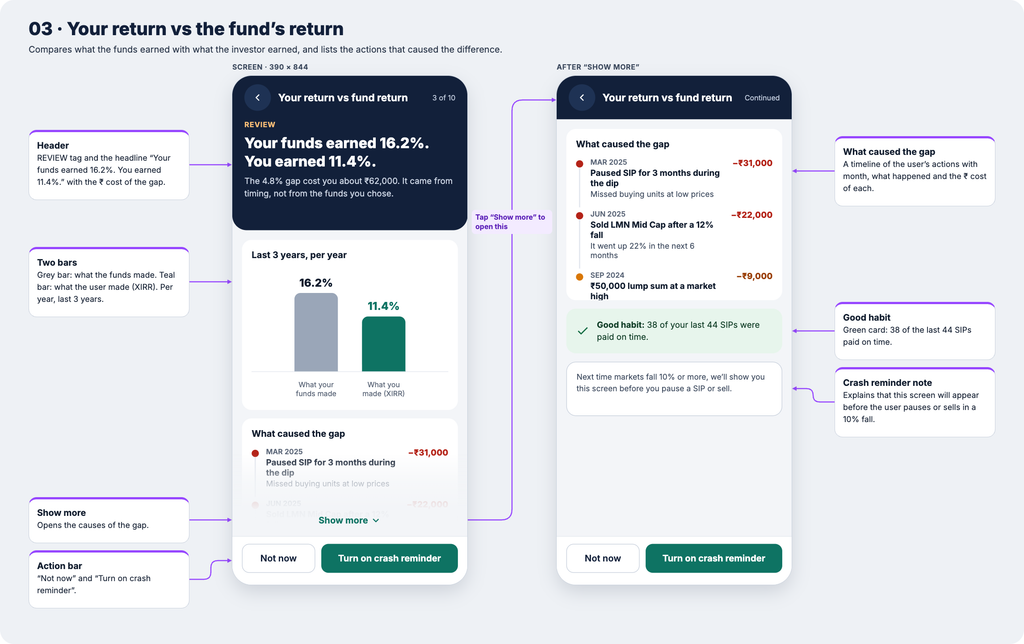
A fund may grow 16% a year. Even so, the investor may earn much less. This gap usually comes from pausing SIPs in a fall, selling in panic or investing a lump sum at a peak.
The screen compares both numbers with two bars. Then a short timeline lists the user’s own actions that caused the gap, each with a rupee cost.
The tone stays kind. It explains rather than blames. Also, the main action is a guard-rail: the app shows this screen again before you pause or sell in the next fall.
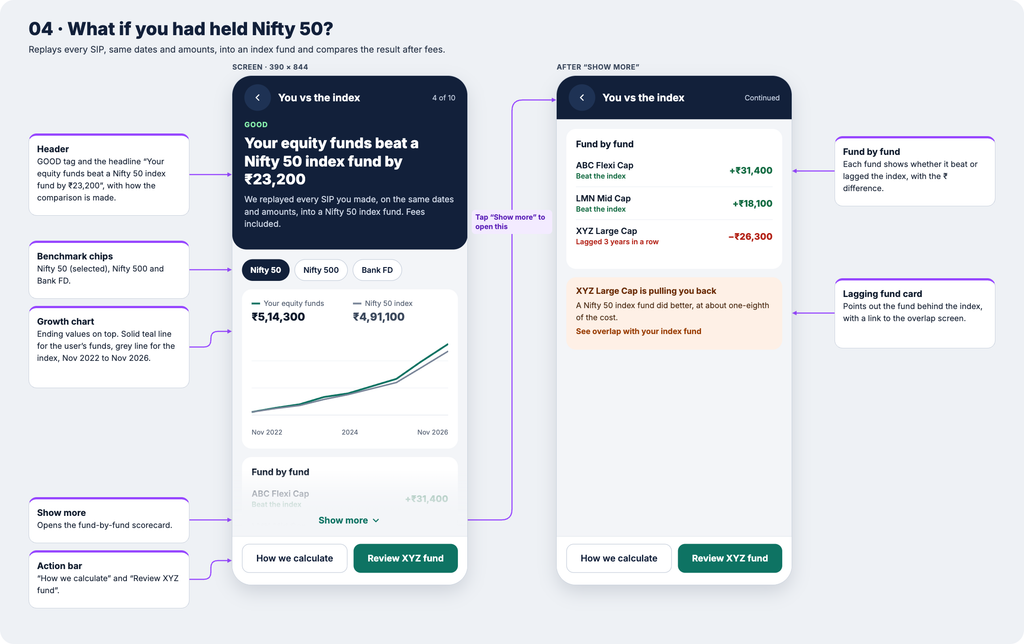
4. What if you had held Nifty 50?
Active funds charge more because they aim to beat the market. Still, few apps check whether that happens for each investor.
This screen replays every SIP on the same dates into a Nifty 50 index fund, after fees. A line chart then compares both paths. Next, a fund-by-fund scorecard shows which funds beat the index and which lagged.
Because this screen can show the app’s own funds losing, users trust it more. Honest mutual fund app insights build long-term loyalty.
5. Tax-aware exit planner
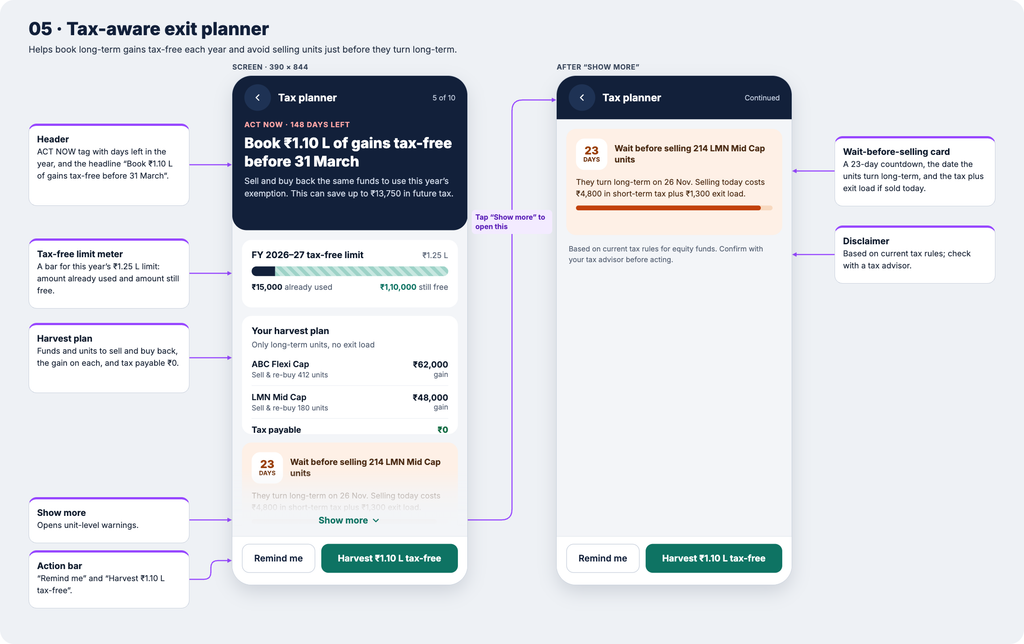
Most apps show capital gains only after you sell. By then, it is too late to plan.
This planner works ahead of time. Its headline says: “Book ₹1.10 L of gains tax-free before 31 March.” A meter shows how much of the yearly ₹1.25 lakh tax-free limit on long-term equity gains is still unused.
The screen also lists which units to sell and buy back. In addition, it warns you when units will turn long-term soon, for example: “Wait 23 days to avoid short-term tax and exit load.”
Build tip: tax rules change in Budgets, so keep these values in a config file.
6. Real wealth and goal readiness
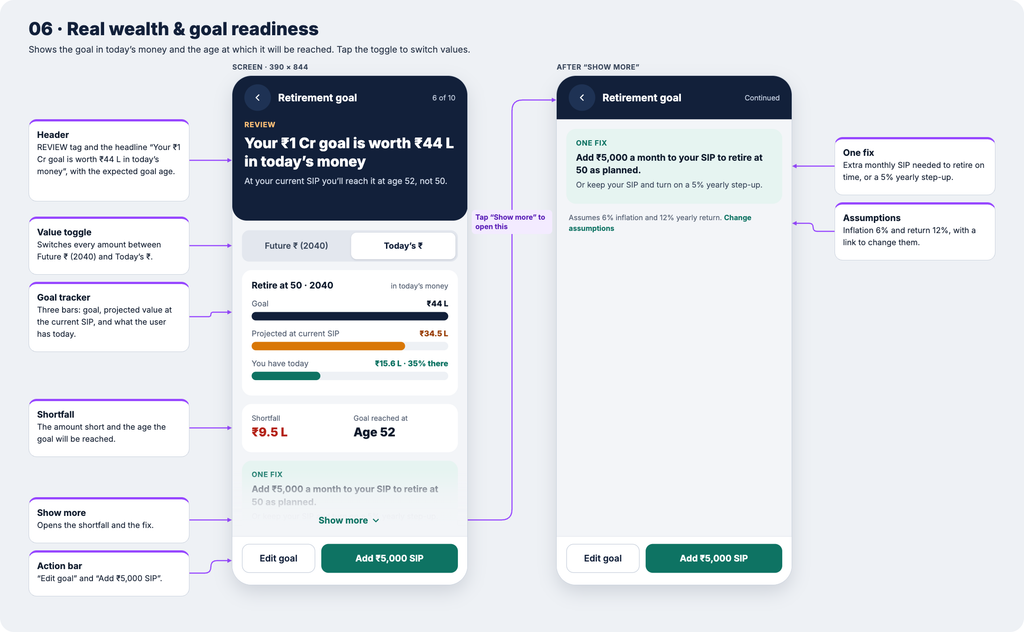
“₹1 crore by 2040” sounds large. After inflation, however, it is worth far less in today’s money.
This screen adds a simple toggle between future rupees and today’s rupees. It shows your goal, your projected value and what you have now. It also shows the age at which you will actually reach the goal.
Finally, it offers one fix, such as the exact extra SIP amount you need to stay on track.
7. Fund health alerts
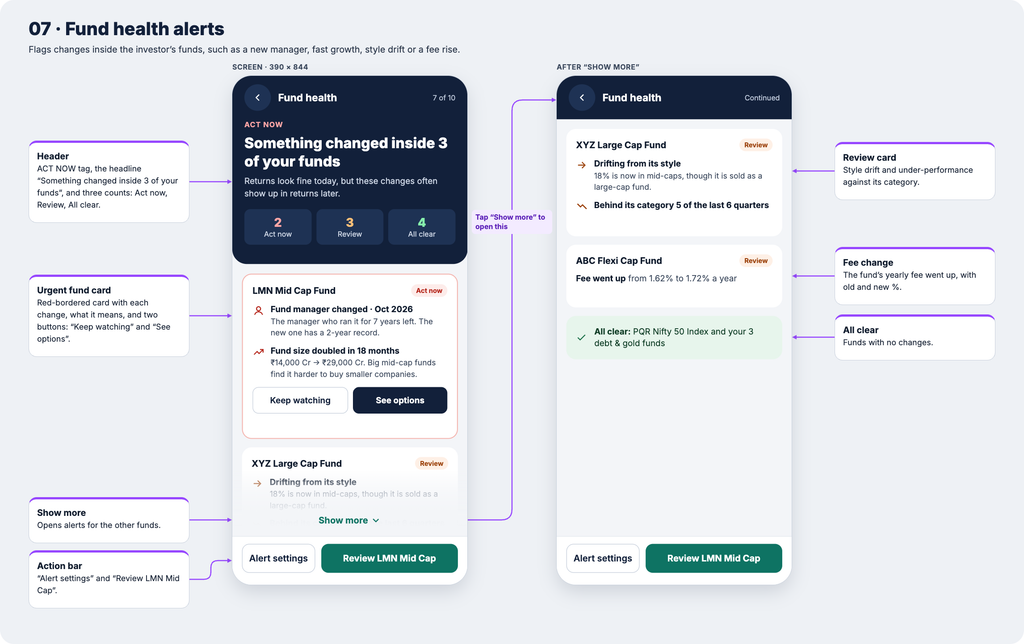
Some changes happen inside a fund long before returns show them. For instance, the fund manager may leave, or the fund may grow too large for its style.
This screen works like an early-warning system. Each fund card explains what changed, why it matters and what you can do. Funds with no issues appear too, so the screen never feels alarming.
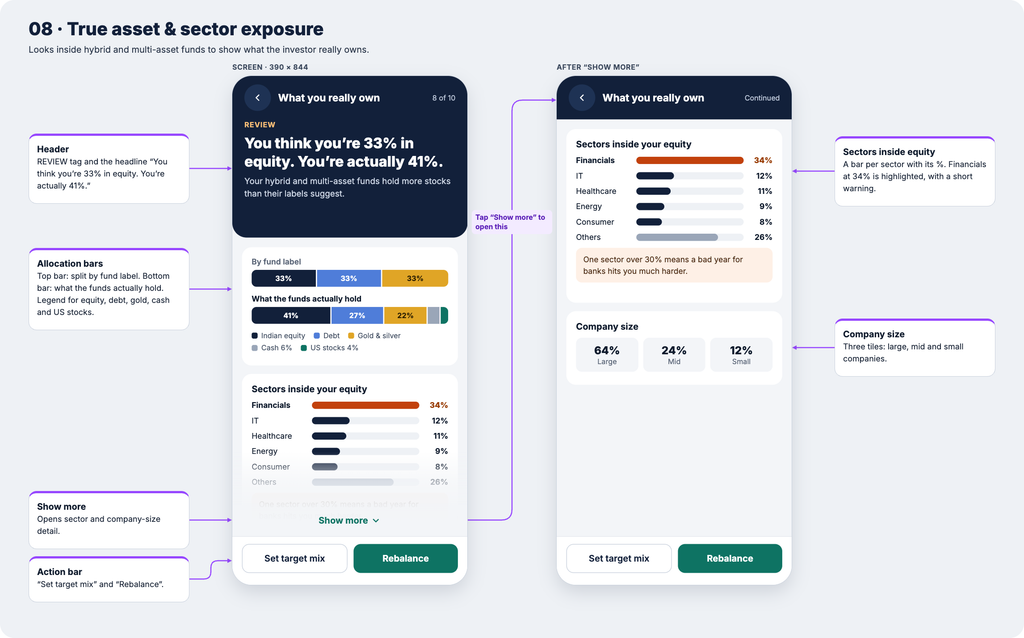
8. True asset and sector exposure
Hybrid and multi-asset funds hold a mix of equity, debt, gold and cash. Most apps count them by their label instead.
As a result, an investor who thinks they hold 33% equity may actually hold 41%. This screen shows both numbers side by side. It also shows sector exposure and flags any sector above 30%.
9. Crash stress test
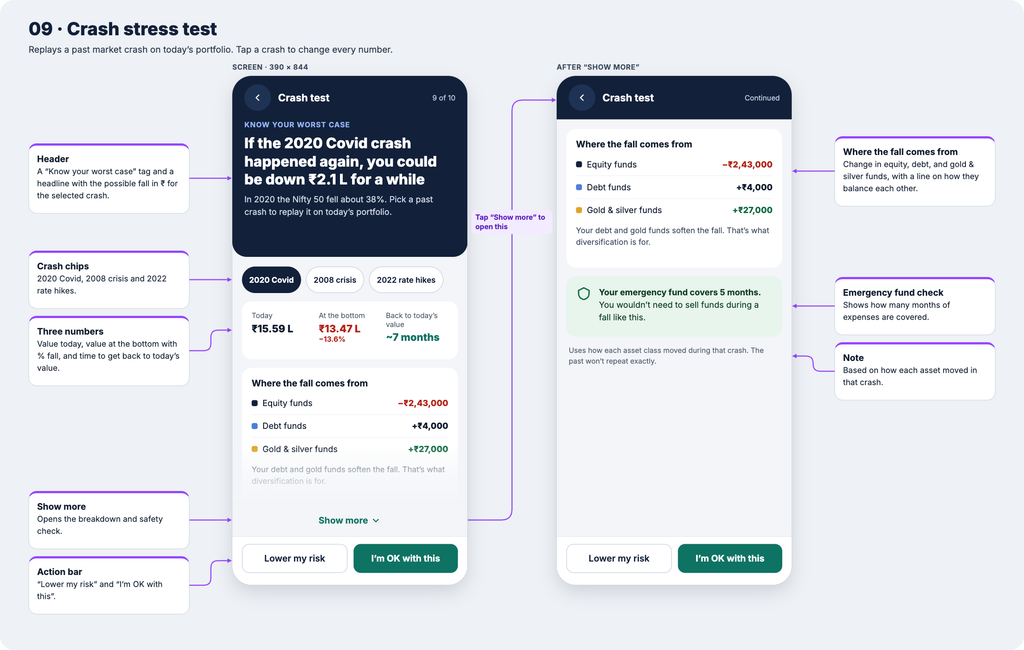
Apps often show rosy projections. In contrast, they rarely show the worst case.
This screen lets you tap a past crash, such as 2020, 2008 or 2022. It then replays that fall on today’s portfolio. You see the drop in rupees, the drop in percent and the time markets took to recover.
It also checks your emergency fund. In this way, users feel prepared rather than shocked when markets fall.
10. SIP step-up and the cost of delay
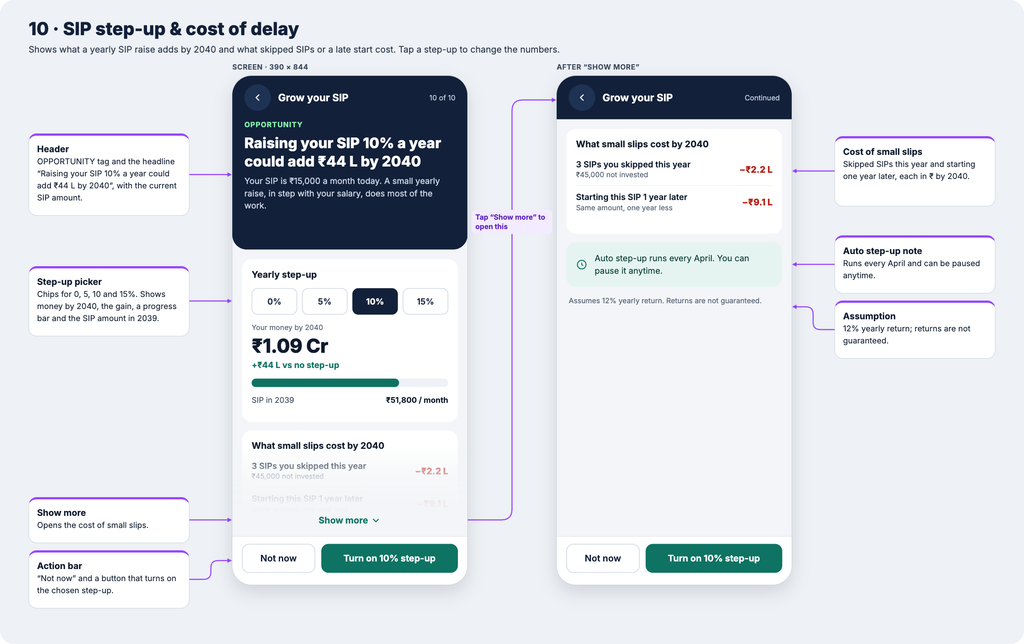
Salaries usually rise every year. Most SIPs, however, stay the same for years.
This screen lets you tap a yearly step-up of 0%, 5%, 10% or 15%. The projected value then updates instantly. It also shows what small slips cost, such as three skipped SIPs or starting a year late.
One tap turns on auto step-up, and you can pause it anytime.
How the home screen ties all mutual fund app insights together
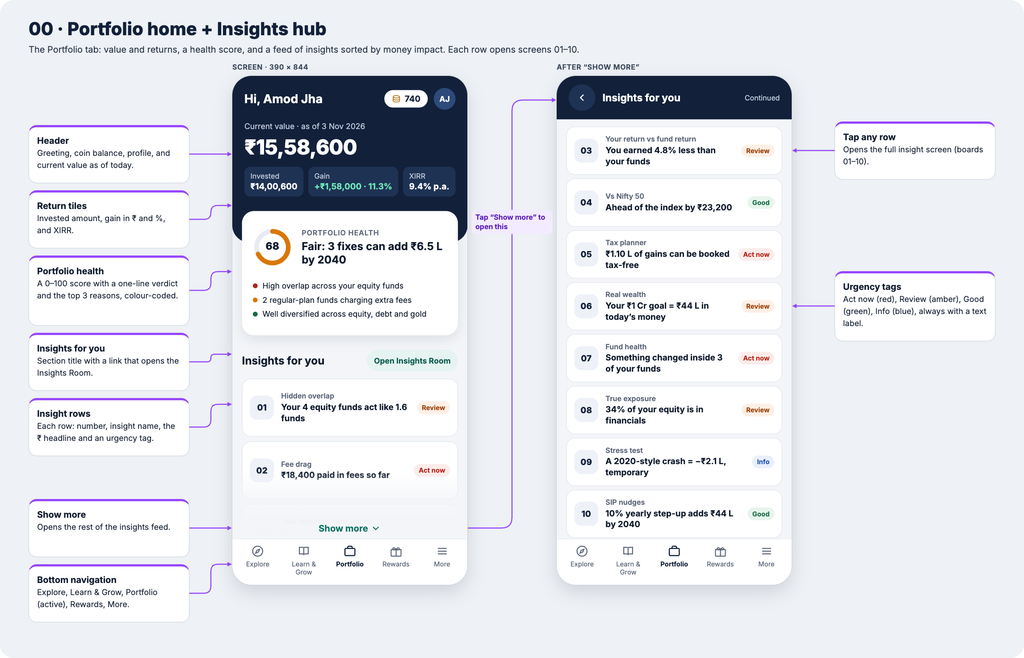
All 10 mutual fund app insights feed into one home screen. A Portfolio Health score from 0 to 100 gives a quick verdict. Gains appear in rupees, percent and XIRR.
Below that, an “Insights for you” feed lists every insight. It is sorted by money impact, so the most valuable action always comes first.
Most of this data already exists. Apps can use transaction history, the user’s CAS statement, monthly fund portfolio disclosures and NAV history. The real challenge is design: turning data into one clear sentence and one clear action.
Conclusion: why mutual fund app insights win
The next generation of investment apps will not win on how fast you can buy a fund. Instead, they will win on how well they help you understand what you already own.
Returns tell you the score. Mutual fund app insights tell you how to play better.
Are you building or designing a wealth app? I would love to hear which insight your users need most. Share your thoughts in the comments.